IPMI Sensor Readings
I try to monitor as many of the motherboard sensors as possible, since they often reveal a variety of hidden problems. Unfortunately, there is not a single universal source of motherboard sensor data available, so I have had to write multiple script templates that each pull sensor readings from device-specific sources, and then make them look and feel the same inside Cacti. This specific script template is for the IPMI hardware sensors that are typically provided on server-class motherboards, as exposed through the ipmitool utility that is often bundled with Linux distributions.
Specifically, IPMI is the Intelligent Platform Management Interface, which is a collection of protocols and services developed by Intel that are designed to allow administrators to monitor and manage their server hardware (ie, you can reboot your servers, access the system BIOS through terminal emulation, and monitor a variety of sensors, all through remote TCP/IP interfaces). Since IPMI provides a documented and consistent method of monitoring server hardware, it is also a potential avenue for monitoring server hardware with Cacti.
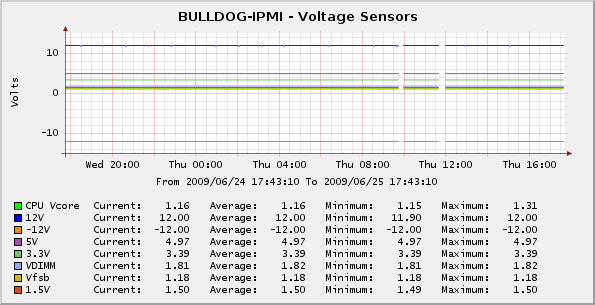
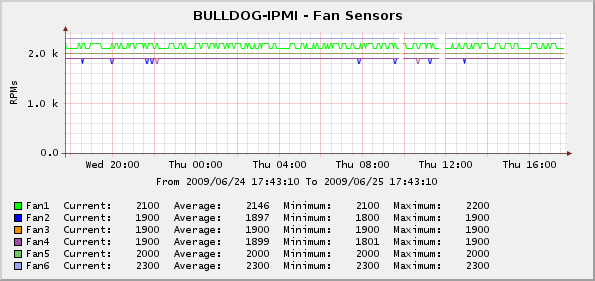
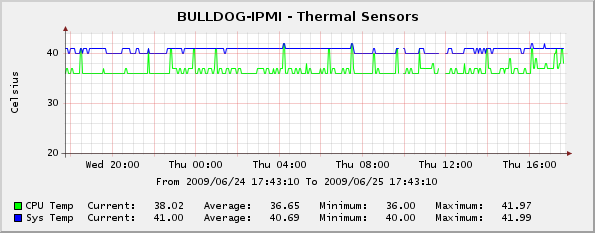
For illustration purposes, the graph in the figure at right shows eight of the ten voltage readings from one of my Suipermicro PDSME+ server with an IPMI card. Additional graphs show six fan sensors and two temperature sensors.
Unfortunately, there are some caveats and difficulties with integrating IPMI into Cacti, which are worth discussing in detail. First, the motherboard must have IPMI enabled with a reachable IP address, but many motherboards require that IPMI have a dedicated address in order to avoid conflicts with the host operating system. In such a case, the IPMI interface will have a different address from the host entry in Cacti. Furthermore, the IPMI address is not likely to support common management interfaces such as SNMP or WMI, so the address will have to be probed with test conditions that are also different from the tests used against the host operating system (IE, you may not be able to use SNMP probes). Cumulatively, this means that IPMI devices must be monitored separately from the host devices that they are linked to.
In addition, IPMI interfaces often have access controls that require the Cacti script template to be store a username and a password. However, Cacti does not provide a facility for storing secondary security credentials with a device entry, and instead only allows its own SNMPv3 credentials to be used for this type of purpose. As such, this script template requires that the IPMI credentials be stored in the Cacti SNMPv3 username and password fields for the IPMI-specific device entry. Alternatively, administrators can create a NULL IPMI account that has read-only access to the senssors, and leave the Cacti SNMPv3 credentials blank.
Since IPMI is not a widely supported management interface, a dedicated IPMI monitoring tool must be used for all Cacti probes and queries. In the case of this script template, the open source ipmitool is used for all sensor lookups and readings. Therefore, you must have a working copy of the ipmitool program installed, and you may need to specify a complete pathname to the executable within the script template script to ensure that it is successfully executed.
Unfortunately, ipmitool does not provide an easy way to ask for a single sensor reading, so all of the lookups and queries have to request all of the sensors readings and extract the specific readings individually. IPMI queries can be slow, so if you are asking for a dozen sensors on a dozen hosts you could easily consume a couple of minutes of time (each query is executed in series and is fully blocking within Cacti). At some point I hope to revisit this and implement a caching system that keeps sensor data on disk for a minute or two, so that queries for each sensor will only have to read the previous results, but for right now be aware that time delay will probably be an issue.
Taken as a whole, administrators are generally encouraged to find some other means of monitoring host sensors, and should only use this method if sensor data cannot be extracted through lmSensorss and NetSNMP on Linux, or Everest and WMI on Windows.
Installation
To use this script template, perform the following steps:
- Obtain a working copy of the ipmitool binary,
and store it in a directory with enough permissions where it will be found
when the Cacti poller is executed (note that cron typically
uses a very limited path variable). You may be able to download a pre-made
binary for your Linux distribution from an online package repository, or in
worst case scenarios you may need to compile the program from source. Verify
that ipmitool is able to read the sensors on
the target systems by issuing test queries for "sdr" first with
the IPMI administrator account and then separately with any restricted-privilege
user accounts. If you want to use the IPMI null user account with this script,
you may need to enable that account on the remote BMC with the commmand
ipmitool
   user enable 1
and then use the-U "" -P ""command-line parameters on subsequent queries. In the sample below, ipmitool is able to successfully query the sensor devices on a remote IPMI host with the null username:
[ root# ] ipmitool sdr -H bulldog-ipmi -U "" -P "" CPU Temp | 36 degrees C | ok Sys Temp | 41 degrees C | ok CPU Vcore | 1.15 Volts | ok 1.5V | 1.50 Volts | ok 3.3V | 3.39 Volts | ok 5V | 4.97 Volts | ok 12V | 12 Volts | ok -12V | -12 Volts | ok VDIMM | 1.81 Volts | ok 5VSB | 4.85 Volts | ok Vfsb | 1.18 Volts | ok VBAT | 3.14 Volts | ok Fan1 | 2100 RPM | ok Fan2 | 1900 RPM | ok Fan3 | 1900 RPM | ok Fan4 | 1900 RPM | ok Fan5 | 2000 RPM | ok Fan6 | 2300 RPM | ok Intrusion | 0 unspecified | ok Power Supply | 0 unspecified | ok CPU Internal Er | 0 unspecified | cr CPU Overheat | 0 unspecified | cr Thermal Trip | 0 unspecified | ok - Download cacti-ipmitool-sensors.0.5.tar.gz to a temporary directory on the Cacti server machine.
- Expand the archive with the command
tar -xvzf cacti-ipmitool-sensors.tar.gz, and change to the cacti-ipmi-sensors directory that is created. - Copy scripts/ss_ipmitool_sensors.php to the <cacti>/scripts/ directory.
- Using a text editor of your choice, change the values for ipmi_username and ipmi_password in the XML files in the resource directory to reflect the credentials for your network, and then copy the resulting files to the <cacti>/resource/script_server/ directory. Note that Cacti does not currently provide a way to associate program-specific variables with a data query, so the IPMI authentication credentials have to be stored somewhere they can be read by the script.
- Access the Cacti installation in a web browser, click on the "Import Templates" menu item on the left side of the Console screen, open the templates folder, and import the three data query templates. Cacti should automatically create the required data templates, data input methods, graph templates, and data queries.
- Click on the "Data Queries" menu item on the left side of the Console screen and verify that a "IPMI - Fan Sensors" data query is present. Click the name of the object and verify that Cacti was able to locate and read the XML resource file. Repeat this process for the Thermal and Voltage data queries.
- Click on the Devices menu item on the left side of the Console screen, select a device that has an accessible IPMI interface, and scroll down to the "Associated Data Queries" table at the bottom of the screen. Select "IPMI - Fan Sensors" in the "Add Data Query" drop-down box, and click the "Add" button. Repeat this step for the Thermal and Voltage data queries.
- After the Device screen reloads, verify that the data queries added in step 7 above are present, and then click the "Create Graphs for this Host" link at the top of the page.
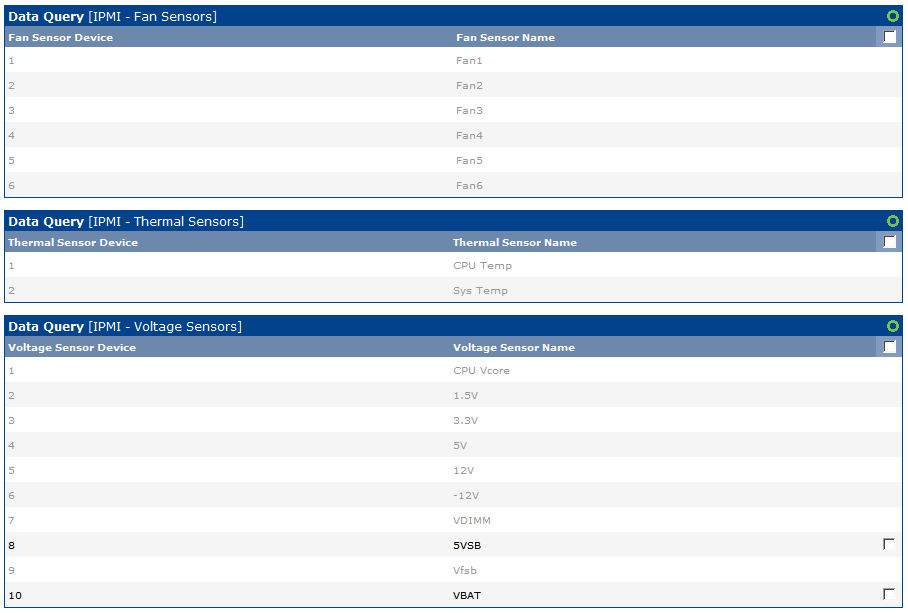
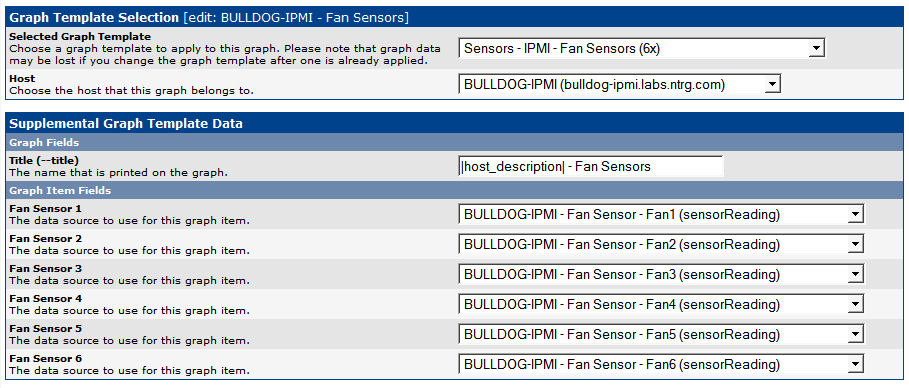
- Once the screen finishes loading, locate the "IPMI - Fan Sensors" data query, which should be similar to the figure at right. Select the sensors that you want to monitor, and click the "Create" button at the bottom of the screen to include them in the polling process. Repeat this process for the Thermal and Voltage data queries as desired.
Note: these files are intended to be used with Cacti 0.8.6 and 0.8.7 and PHP 5.2, and may not operate as expected with other versions.
Multi-Sensor Graphs
The process described above will result in each sensor device having its own graph. If you would like to consolidate multiple sensors of a specific type into a single graph, the script template includes graph templates that can be used to pull readings from each of the individual data sources simultaneously, although some editing will likely be required. To use these graph templates, perform the following steps:
- Access the Cacti installation in a web browser, click on the "Import Templates" menu item on the left side of the Console screen, open the templates folder, and import the three "8x" graph templates. If you encounter the error "(GPRINT Preset) Exact Numbers" during the import process, you will need to take the following corrective action:
- If you are running an older version of Cacti 0.8.6, you may need to create the Exact Numbers GPRINT manually. To do so, click on the Graph Management menu item on the left side of the Console screen, and then click on the GPRINT Presets sub-menu item. Create a GPRINT Preset with the name of "Exact Numbers" and the Text value of "%8.0lf". After the GPRINT has been created, you can try to import the 8x graph templates again.
- Sometimes the graph items can become disassociated from the data source placeholders during the import process. To investigate if this is the problem, click on the "Graph Templates" menu item on the left side of the Console screen, open the 8x templates that caused the error to be reported, scroll down to the "Graph Item Inputs" section, and click on the top entry. The screen should reload with all of the graph items enumerated, and the top five graph items should have their selection boxes enabled (thereby indicating that they are associated with this entry). If the selection boxes for the top five items are not enabled, manually enable them and save the changes. Repeat this process for all of the graph items to ensure that all of the graph items are correctly associated with a data source.
- If you have exactly eight sensors of a specific type, you do not need to edit the associated graph template. However, if you have less than eight sensors of a specific type, you will need to create a copy of the associated graph template that refers to the exact number of sensors available. Similarly, if you have more than eight sensors of a specfic type, you will need to spread them across two or more consolidated graphs, and would need to create copies of the associated graph template that contain the necessary number of data sources that total the cumulative number of sensors available. To create copies of the graph template(s), click the "Graph Templates" menu item on the left side of the Console screen. For each copy, select the appropriate 8x graph template in the list, choose "Duplicate" in the drop-down list at the bottom of the screen, and then click the "Go" button. You will then need to edit each copy, delete any individual graph items that reference unused data sources, and assign a new name to the graph template.
- Once the appropriate-sized graph templates have been created, click the "Graph Management" menu item on the left side of the Console screen. Once the resulting screen finishes loading, click the "Add" button in the upper right corner to create a new consolidated graph.
- Locate the appropriate graph template from the "Selected Graph Template" drop-down list, then choose the target device from the "Host" drop-down list, and then click the "Create" button to proceed.
- In the resulting screen, you will be presented with a list of the data source entries in the graph template, and given the opportunity to match each data source entry with a data source from the device. Each of the device-specific data sources were created when the individual sensors were selected for monitoring, so each sensor that is currently being monitored has its own discrete data source that can be incorporated into the consolidated graph. Choose the data sources that you would like to incorporate, and then click the "Save" button when finished.
- After the graph has been created, click on the "Graph Management" menu item on the left side of the Console screen, and verify that the graph you have just created is shown in the list. If you would like to use only the consolidated graph, you may also delete the individual sensor-specific graphs from this screen. If you do this, however, do not delete the data sources associated with the individual graphs, as those will still be needed for the consolidated graph.
Script Input and Output
In some cases you may want to execute the script file manually for debugging purposes. The parameters to the script use a fixed structure that is optimized for use with the Cacti poller, but also allows for human interaction. In particular, the script uses three parameter groups, with the exact structure depending on the output that is desired.
The first parameter group provides an IPMI protocol "bundle" of the following values, separated by colon characters: In those cases where a value is unneeded (such as a null password), the value can be omitted.
- hostname: The domain name or IP address of the target device. This value is mandatory.
- ipmi username: Part of the credentials for WMI queries. IPMI allows for a special "null" user (akin to an anonymous account) that can be selected by leaving this field empty.
- ipmi password : Part of the credentials for WMI queries. A null password can be specified by leaving this field empty.
Taken as a whole, a valid IPMI bundle for the "localhost" device with a null username and password would be "localhost::".
The next parameter identifies the sensor type for the queries. The sensor type must be specified as either "fan", "temperature" or "voltage". The sensor type is needed in order to locate the correct data, and is also used to normalize some types of response strings, and as such must always be specified.
The next parameter identifies the type of Cacti data that is being requested. Cacti uses "index" queries to enumerate all of the entries for a data query template, and then uses various kinds of "query" queries to obtain extended information about those entries (such as the full name of each indexed entry). Separately, the Cacti poller uses "get" queries to fetch the readings for each specific entry (again, keyed by index value). Note that he index and query operations are typically only performed when the device entry is being created or modified, and the get operations provide the actual readings to the poller. This script parameter must be one of those query types, with any remaining parameters providing any necessary supplemental data. Specifically the request parameters are one of the following:
- index: This request asks for a list of sensor device identifiers. No additional input data is needed. The response data is provided as a series of index values, with each sensor being enumerated on a separate response line.
- query <fieldname>: This request asks for the specified field data associated with each sensor device. The response data is provided as "index:data" pairs, where the index value is the primary device identifier, and the data value is the requested field data as available.
- get <fieldname> <sensor>: This request asks for the specified field data associated with the specified sensor device. The requested data is provided by itself with no other accompanying information.
The field names that can be used in "query" or "get" requests are as follows:
- sensordevice: The index value for the sensor(s).
- sensorname: The human-friendly name for the sensor(s).
- sensorreading: The current reading for the sensor(s). For example, "12" volts, or "2300" RPMs.
You must know the index value that has been assigned to a device before you can ask for details about that specific device. To do this, you can use the "query sensorname" request to get a list of sensors and their descriptions, and then use the "get <fieldname> <sensor>" request to get information about the desired sensor. The full command lines for these requests, using example data from above, are shown below:
$ php ss_ipmitool_sensors.php hostname:: voltage query sensorname
1:CPU Vcore
2:1.5V
3:3.3V
4:5V
5:12V
6:-12V
7:VDIMM
8:5VSB
9:Vfsb
10:VBAT

$ php ss_ipmitool_sensors.php hostname:: voltage get sensorreading 1
1.15

Copyright © 2010-2017 Eric A. Hall.