WBEM/CIM Sensor Readings
I try to monitor as many of the motherboard sensors as possible, since they often reveal a variety of hidden problems. Unfortunately, there is not a single universal source of motherboard sensor data available, so I have had to write multiple script templates that each pull sensor readings from device-specific sources, and then make them look and feel the same inside Cacti. This specific script template is for instances of the CIM NumericSensor class, as obtained with the wbemcli tool on Linux.
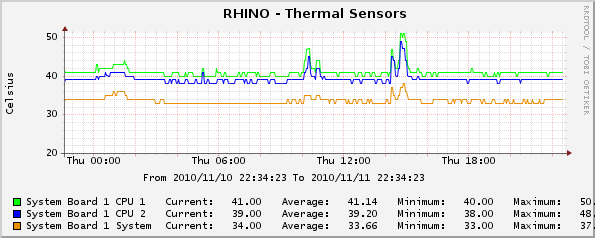
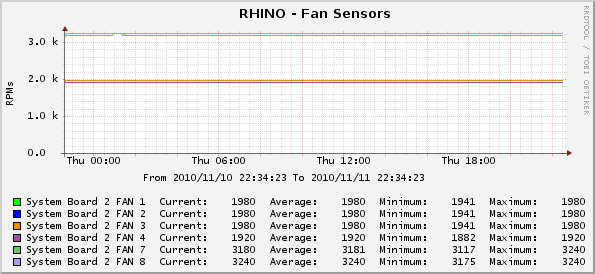
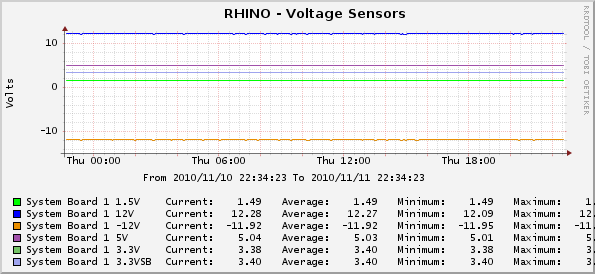
For illustration purposes, the graph in the figure at right shows the thermal sensor readings for a VMware ESXi 4.1 host with a Supermicro X6DHE-XG2 motherboard with two Xeon processors. Additional graphs from that same system show six fan speed sensors and six voltage sensors.
WBEM is not yet widely popular in a form that is usable by this tool. Although there are WBEM servers available for Linux but all of the administrators I know still use SNMP or scripts to monitor those systems, and do not even have the WBEM components installed. Meanwhille, recent versions of Microsoft Windows use the CIM NumericSensor class to describe some motherboard sensors, but they are not directly accessible with SOAP-over-HTTP queries, and are therefore not directly accessible to this tool. It is my understanding that some server manufacturers provide WBEM agents with their management software, which means that those systems may be accessible to this tool, but I have not confirmed anything. In my case, I need it to monitor VMware ESXi 4.1 servers, and that is all that I have tested it with so far. If you find that these templates work with some other system, please send me a message and tell me about it.
Installation
To use this script template, perform the following steps:
- Obtain a working copy of the wbemcli toolkit,
and store it in a directory with enough permissions where it will be found
when the Cacti poller is executed (note that cron typically
uses a very limited path variable). You may be able to download a pre-made
binary for your Linux distribution from an online package repository, or in
worst case scenarios you may need to compile the program from source. Verify
that the program is able to enumerate the CIM_NumericSensor instances on the
target systems by issuing test queries to the desired system with the system
administrator account, and then test any restricted-privilege user accounts
separately. In the example below, wbemcli is
able to successfully query the sensor devices on the "rhino.ntrg.com" host
across the HTTPS transport, using the default WBEM-HTTPS port, and the username
and password of "cim":
[ root# ] wbemmcli ein -nl -noverify \ 'https://cim:cim@rhino.ntrg.com:5989/root/cimv2:CIM_NumericSensor' rhino.labs.ntrg.com:5989/root/cimv2:OMC_NumericSensor,...,DeviceID="16.0.32.99" rhino.labs.ntrg.com:5989/root/cimv2:OMC_NumericSensor,...,DeviceID="15.0.32.99" rhino.labs.ntrg.com:5989/root/cimv2:OMC_NumericSensor,...,DeviceID="14.0.32.99" rhino.labs.ntrg.com:5989/root/cimv2:OMC_NumericSensor,...,DeviceID="13.0.32.99" ... - Download cacti-wbem-sensors.0.1.tar.gz to a temporary directory on the Cacti server machine.
- Expand the archive with the command
tar -xvzf cacti-wbem-sensors.tar.gz, and change to the cacti-wbem-sensors directory that is created. - Copy scripts/ss_wbem_sensors.php to the <cacti>/scripts/ directory.
- Using a text editor of your choice, change the values for username and password in the XML files in the resource directory to reflect the credentials for your network, and then copy the resulting files to the <cacti>/resource/script_server/ directory. Note that Cacti does not currently provide a way to associate program-specific variables with a data query, so the authentication credentials have to be stored in the file in order for them to be passed to the script.
- Access the Cacti installation in a web browser, click on the "Import Templates" menu item on the left side of the Console screen, open the templates folder, and import the three data query templates. Cacti should automatically create the required data templates, data input methods, graph templates, and data queries.
- Click on the "Data Queries" menu item on the left side of the Console screen and verify that a "WBEM Fan Sensors" data query is present. Click the name of the object and verify that Cacti was able to locate and read the XML resource file. Repeat this process for the Thermal and Voltage data queries.
- Click on the Devices menu item on the left side of the Console screen, select a device that is publishing sensor data through WBEM, and scroll down to the "Associated Data Queries" table at the bottom of the screen. Select "WBEM Fan Sensors" in the "Add Data Query" drop-down box, and click the "Add" button. Repeat this step for the Thermal and Voltage data queries.
- After the Device screen reloads, verify that the data queries added in step 7 above are present, and then click the "Create Graphs for this Host" link at the top of the page.
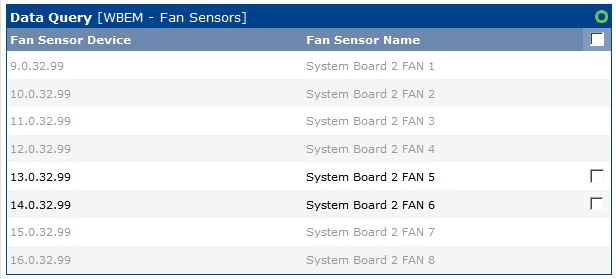
- Once the screen finishes loading, locate the "WBEM Fan Sensors" data query, which should be similar to the figure at right. Select the sensors that you want to monitor, and click the "Create" button at the bottom of the screen to include them in the polling process. Repeat this process for the Thermal and Voltage data queries as desired.
Note that these files are intended to be used with Cacti 0.8.7 and PHP 5.3, and may not operate as expected with other versions.
Multi-Sensor Graphs
The process described above will result in each sensor device having its own individual graph. The tarfile includes graph templates that can be used to pull readings from each of the individual data sources into a single graph, although some editing is required. To use these graph templates, perform the following steps:
- Access the Cacti installation in a web browser, click on the "Import Templates" menu item on the left side of the Console screen, open the templates folder, and import the three "8x" graph templates. If you encounter the error "(GPRINT Preset) Exact Numbers" during the import process, you will need to take the following corrective action:
- If you are running an older version of Cacti 0.8.6, you may need to create the Exact Numbers GPRINT manually. To do so, click on the Graph Management menu item on the left side of the Console screen, and then click on the GPRINT Presets sub-menu item. Create a GPRINT Preset with the name of "Exact Numbers" and the Text value of "%8.0lf". After the GPRINT has been created, you can try to import the 8x graph templates again.
- Sometimes the graph items can become disassociated from the data source placeholders during the import process. To investigate if this is the problem, click on the "Graph Templates" menu item on the left side of the Console screen, open the 8x templates that caused the error to be reported, scroll down to the "Graph Item Inputs" section, and click on the top entry. The screen should reload with all of the graph items enumerated, and the top five graph items should have their selection boxes enabled (thereby indicating that they are associated with this entry). If the selection boxes for the top five items are not enabled, manually enable them and save the changes. Repeat this process for all of the graph items to ensure that all of the graph items are correctly associated with a data source.
- If you have exactly eight sensors of a specific type, you do not need to edit the associated graph template. However, if you have less than eight sensors of a specific type, you will need to create a copy of the associated graph template that refers to the exact number of sensors available. Similarly, if you have more than eight sensors of a specific type, you will need to spread them across two or more consolidated graphs, and would need to create copies of the associated graph template that contain the necessary number of data sources that total the cumulative number of sensors available. To create copies of the graph template(s), click the "Graph Templates" menu item on the left side of the Console screen. For each copy, select the appropriate 8x graph template in the list, choose "Duplicate" in the drop-down list at the bottom of the screen, and then click the "Go" button. You will then need to edit each copy, delete any individual graph items that reference unused data sources, and assign a new name to the graph template.
- Once the appropriate-sized graph templates have been created, click the "Graph Management" menu item on the left side of the Console screen. Once the resulting screen finishes loading, click the "Add" button in the upper right corner to create a new consolidated graph.
- Locate the appropriate graph template from the "Selected Graph Template" drop-down list, then choose the target device from the "Host" drop-down list, and then click the "Create" button to proceed.
- In the resulting screen, you will be presented with a list of the data source entries in the graph template, and given the opportunity to match each data source entry with a data source from the device. Each of the device-specific data sources were created when the individual sensors were selected for monitoring, so each sensor that is currently being monitored has its own discrete data source that can be incorporated into the consolidated graph. Choose the data sources that you would like to incorporate, and then click the "Save" button when finished.
- After the graph has been created, click on the "Graph Management" menu item on the left side of the Console screen, and verify that the graph you have just created is shown in the list. If you would like to use only the consolidated graph, you may also delete the individual sensor-specific graphs from this screen. If you do this, however, do not delete the data sources associated with the individual graphs, as those will still be needed for the consolidated graph.

Script Input and Output
In some cases you may want to execute the script file manually for debugging purposes. The parameters to the script use a fixed structure that is optimized for use with the Cacti poller, but also allows for human interaction. In particular, the script uses three parameter groups, with the exact structure depending on the output that is desired.
The first parameter group provides a WBEM protocol "bundle" of the following values, separated by colon characters: In those cases where a value is unneeded (such as a default value, or a null password), the value can be omitted.
- hostname: The domain name or IP address of the target device.
This value is mandatory.
Note: WBEM uses the HTTP protocol syntax and all of it's data-types, and as such it requires that hostnames exactly match the hostname of the WBEM server. If your target system uses "host.domain.tld" naming internally, then you will almost certainly have to use the same name in your query, or else the HTTP transport protocol will be unable to establish a session for the WBEM queries to ride on. - transport: WBEM queries can use HTTP or HTTPS as the transport protocol (there are slight differences in the protocol negotiation). The default value for this parameter is HTTPS.
- port number: WBEM-over-HTTP typically uses TCP port 5988, while WBEM-over-HTTPS typically uses TCP port 5989. Some systems allow the administrator to specify an alternative port number. The default value is set according to the specified tranport protocol.
- username: The username for the HTTP(S) session. The script requires a username to be provided.
- password : The password for the HTTP(S) session. A null password can be specified by leaving this field empty. Note that only the Basic authentication mechanism is currently supported.
Taken as a whole, a valid WBEM authentication bundle for the "rhino.ntrg.com" device with the username of "user" and the password of "pass" would be "rhino.ntrg.com:::user:pass" (this uses the default values of HTTPS and port 5989 for the tranport protocol and target port number).
The next parameter identifies the sensor type for the queries. The sensor type must be specified as either "fan", "temperature" or "voltage". The sensor type is needed in order to locate the correct data, and is also used to normalize some types of response strings, and as such must always be specified.
The next parameter identifies the type of Cacti data that is being requested. Cacti uses "index" queries to enumerate all of the entries for a data query template, and then uses various kinds of "query" queries to obtain extended information about those entries (such as the full name of each indexed entry). Separately, the Cacti poller uses "get" queries to fetch the readings for each specific entry (again, keyed by index value). Note that he index and query operations are typically only performed when the device entry is being created or modified, and the get operations provide the actual readings to the poller. This script parameter must be one of those query types, with any remaining parameters providing any necessary supplemental data. Specifically the request parameters are one of the following:
- index: This request asks for a list of sensor device identifiers. No additional input data is needed. The response data is provided as a series of index values, with each sensor being enumerated on a separate response line.
- query <fieldname>: This request asks for the specified field data associated with each sensor device. The response data is provided as "index:data" pairs, where the index value is the primary device identifier, and the data value is the requested field data as available.
- get <fieldname> <sensor>: This request asks for the specified field data associated with the specified sensor device. The requested data is provided by itself with no other accompanying information.
The field names that can be used in "query" or "get" requests are as follows:
- sensordevice: The index value for the sensor(s).
- sensorname: The human-friendly name for the sensor(s).
- sensorreading: The current reading for the sensor(s). For example, "12" volts, or "2300" RPMs.
You must know the index value that has been assigned to a device before you can ask for details about that specific device. To do this, you can use the "query sensorname" request to get a list of sensors and their descriptions, and then use the "get <fieldname> <sensor>" request to get information about the desired sensor. The full command lines for these requests, using example data from above, are shown below:
$ php ss_wbem_sensors.php rhino.ntrg.com:::user:pass fan query sensorname
16.0.32.99:System Board 2 FAN 8
15.0.32.99:System Board 2 FAN 7
14.0.32.99:System Board 2 FAN 6
13.0.32.99:System Board 2 FAN 5
12.0.32.99:System Board 2 FAN 4
11.0.32.99:System Board 2 FAN 3
10.0.32.99:System Board 2 FAN 2
9.0.32.99:System Board 2 FAN 1

$ php ss_wbem_sensors.php rhino.ntrg.com:::user:pass fan get sensorreading 10.0.32.99
1980

Copyright © 2010-2017 Eric A. Hall.